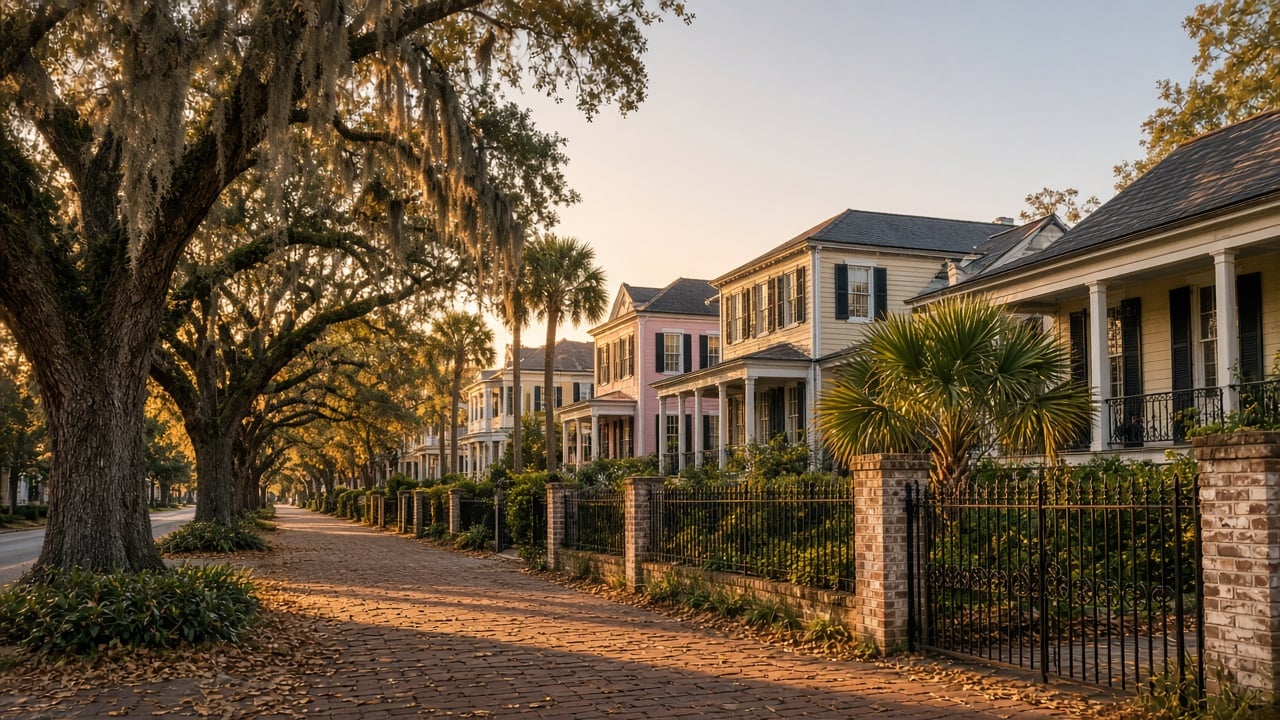
Charleston Homes Sold Faster in October 2026: A Neighborhood-by-Neighborhood Market Update
Market Update
Market Update
Hey neighbors,
The October numbers just came in, and one thing jumped out at me right away: in a lot of our neighborhoods, homes went under contract a whole lot faster than they did a year ago. Prices are a different story depending on where you look, so let's walk through it together, area by area, in plain English.
Quick note: these figures are from the Charleston Trident Association of REALTORS® (CTAR) October 2026 market reports, as packaged by The Cassina Group. A few of these areas only have a handful of sales in a month, so one big sale can swing the averages a lot. I'll flag those.
Across Charleston County, closed sales were up 5.9% compared to last October, and the average sales price rose 4.5% to $1,199,932. So the overall market is steady and active. The more interesting stuff is happening neighborhood by neighborhood.
Here's the headline for me. Compared to October 2025, average days on market dropped in four areas:
If you're a buyer in one of these spots, that means the good ones aren't sitting around. Being pre-approved and ready to see a home the day it hits the market matters.
South Mt. Pleasant (CTAR calls it Lower Mount Pleasant) held steady on the median: up 0.3% to $1,391,250. The average sales price jumped 26.1% to $1,908,171, which tells me some higher-end homes traded this month. Closed sales were flat at 40, and new listings fell 23.9% to 54. Homes averaged 52 days on market, about the same as last year's 49. Translation: fewer fresh options for buyers south of the IOP Connector.
North Mt. Pleasant (Upper Mount Pleasant) went the other way on inventory. New listings were up 44.4% to 104 homes, so buyers have more to choose from. The median price came in at $970,000 (down 14.2%), and the average was $1,077,872 (down 9.7%). Closed sales dipped 28.8% to 47, but the homes that did sell went fast, at 30 days on average.
Want to go deeper on Mt. Pleasant values? I broke it down in Mount Pleasant SC Home Values: What Is My Home Worth in 2026?
Isle of Palms had a busy month. Closed sales rose 33.3% to 20, and homes sold in 41 days on average, down from 66. The median price was $2,480,000 (down 4.6%) and the average was $2,870,600 (down 6.1%). New listings were down 12.5% to 21.
Sullivan's Island had 6 closed sales, compared to just 2 last October. The median was $6,775,000 (down 25.8%) and the average was $8,766,667 (down 3.9%). Homes averaged 152 days on market, up from 118, and only 3 new listings came on. With so few sales, I wouldn't read too much into the percentages here. Every single sale moves the needle.
Downtown's median sales price came in at $1,000,000, down 60.0%, and the average was $1,876,429, down 43.7%. Before anyone panics: with only 14 closed sales (down 6.7%), the mix of what sold makes a huge difference. The more encouraging signs are that new listings were up 21.7% to 28, and homes sold in 37 days on average, down from 70.
The Upper Peninsula had a slower month. Only 8 homes closed (down 38.5%) and 12 new listings came on (down 58.6%). The median was $782,500 (down 34.8%) and the average was $968,500 (down 30.7%). Homes averaged 74 days on market, up from 23 last October, so buyers there have a little more breathing room right now.
West Ashley was one of the strongest stories of the month. Closed sales were up 31.7% to 79, and homes sold in just 27 days on average, down from 53. The median price edged up 2.8% to $545,000, while the average dipped 4.5% to $663,375. New listings were down 17.0% to 93. Strong demand plus fewer new listings is a good setup for sellers.
If you're selling: In West Ashley, North Mt. Pleasant, Downtown and Isle of Palms, well-priced homes are moving quickly. Getting the price right from day one is the whole game. Overpricing just costs you the early buzz.
If you're buying: North Mt. Pleasant has a lot more inventory than last year, and areas like the Upper Peninsula are giving buyers a bit more time. But in the fast-moving spots, you'll want to be ready to act.
Either way: Countywide averages don't tell you what your street is doing. That's where I come in.
Curious what October's numbers mean for your home or your search? Request a free home valuation or reach out and let's chat. No pressure, just good local advice from a neighbor.
It matters who you work with.
Source: Charleston Trident Association of REALTORS® (CTAR) October 2026 Local Market Updates, via The Cassina Group's October 2026 Market Report. Figures compare October 2026 with October 2025.
Market Update
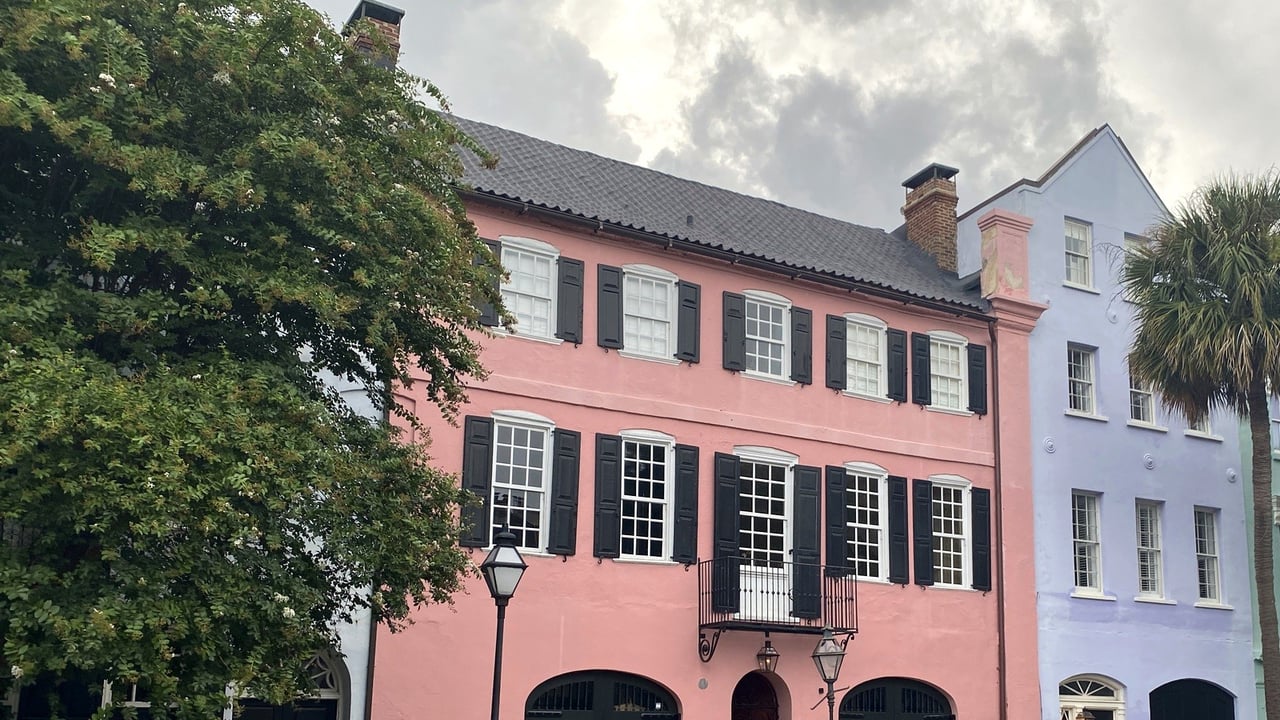
The Charleston County 4% legal residence rate can lower the property tax on the home you live in. But it isn't automatic. Here's who qualifies, what to send, and when … Read more
Market Update

Market Update
October 2026 CTAR numbers for Upper and Lower Mount Pleasant, what moves a home's price, and how a real pricing analysis works.
Market Update
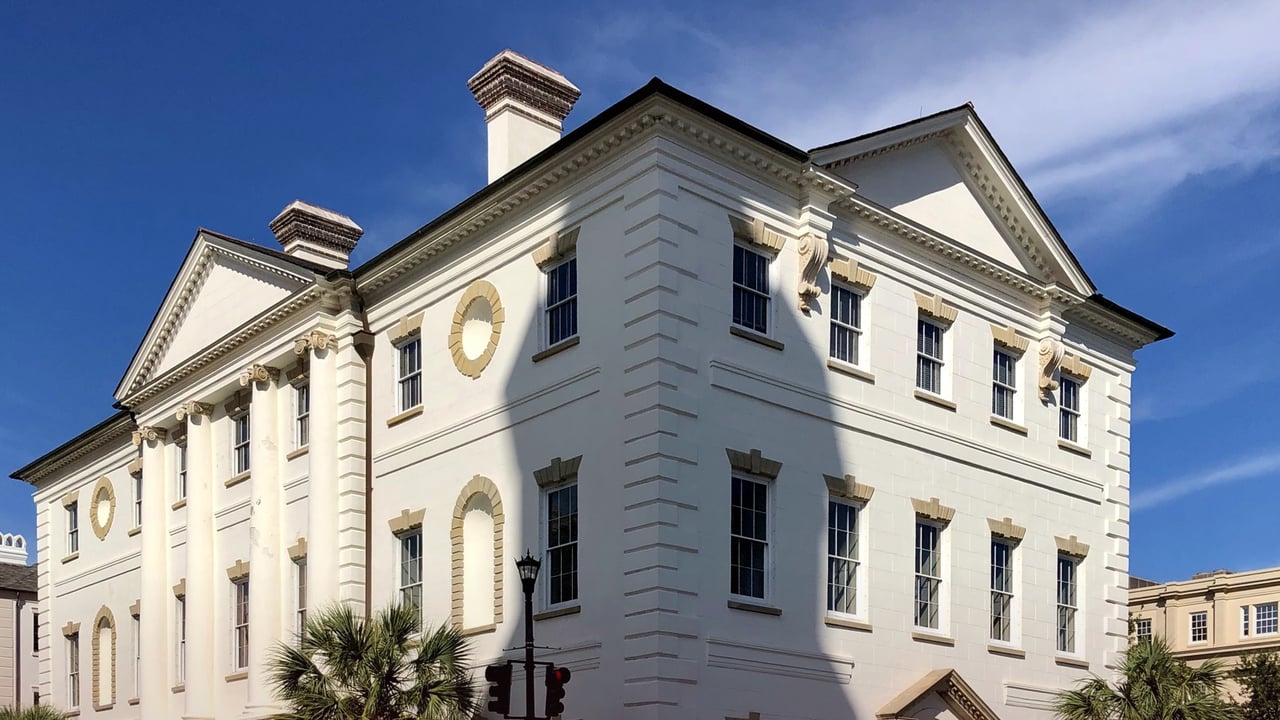
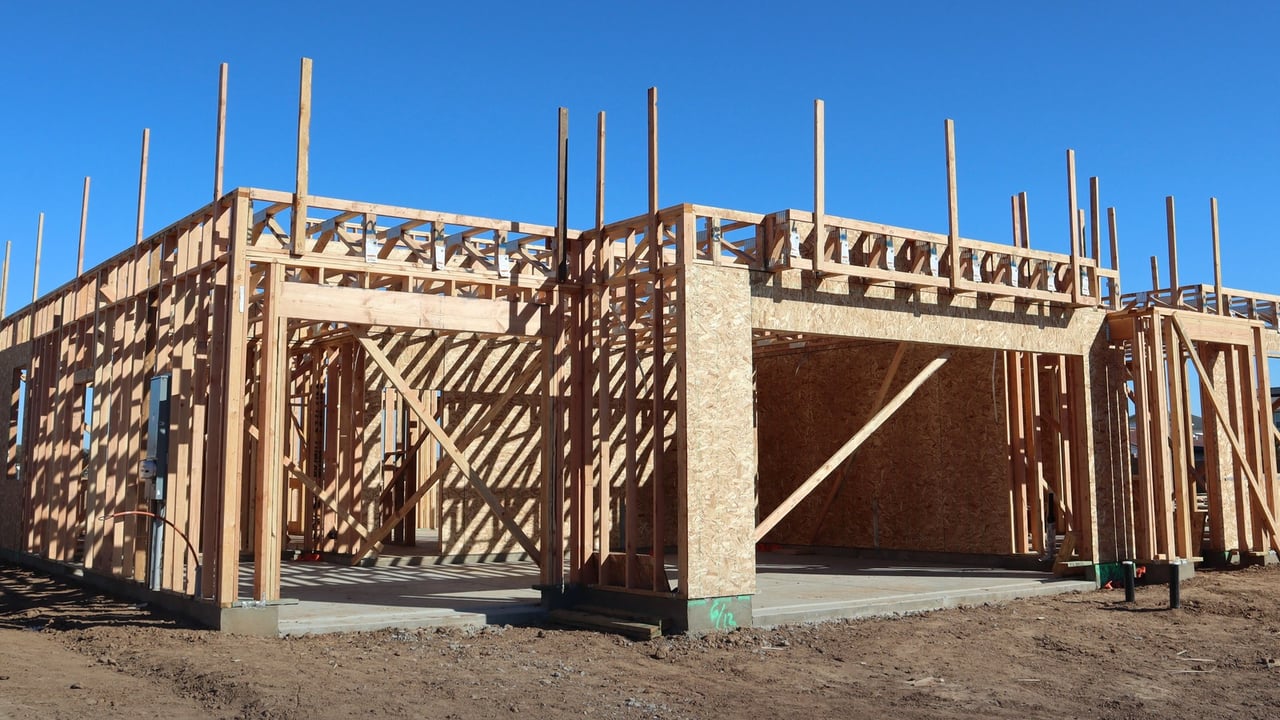
A plain-English guide for buyers and sellers: the deed recording fee, attorney closings, tax prorations and the costs on your Closing Disclosure.
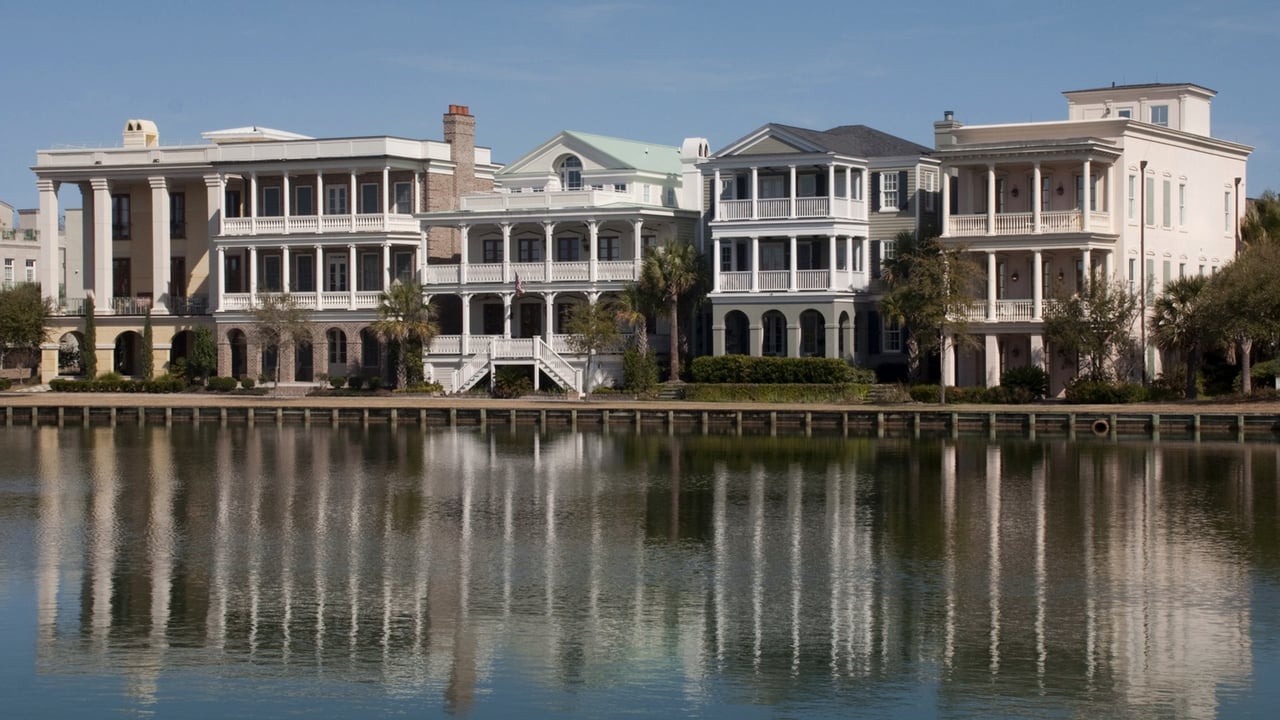
Market Update
2026 home prices, days on market, commutes and county lines for 11 areas around Charleston, side by side.

Three local governments, a big county park, flood zones that vary by street, and what homes sold for this fall.
Market Update
Winter vs. spring by the numbers, and how to get your home ready this season.

Experience the white-glove service you deserve! With a background in sports and entertainment real estate, he exceeds expectations, delivers quality advice, and ensures your best interests are always prioritized. Choose excellence for your real estate journey.