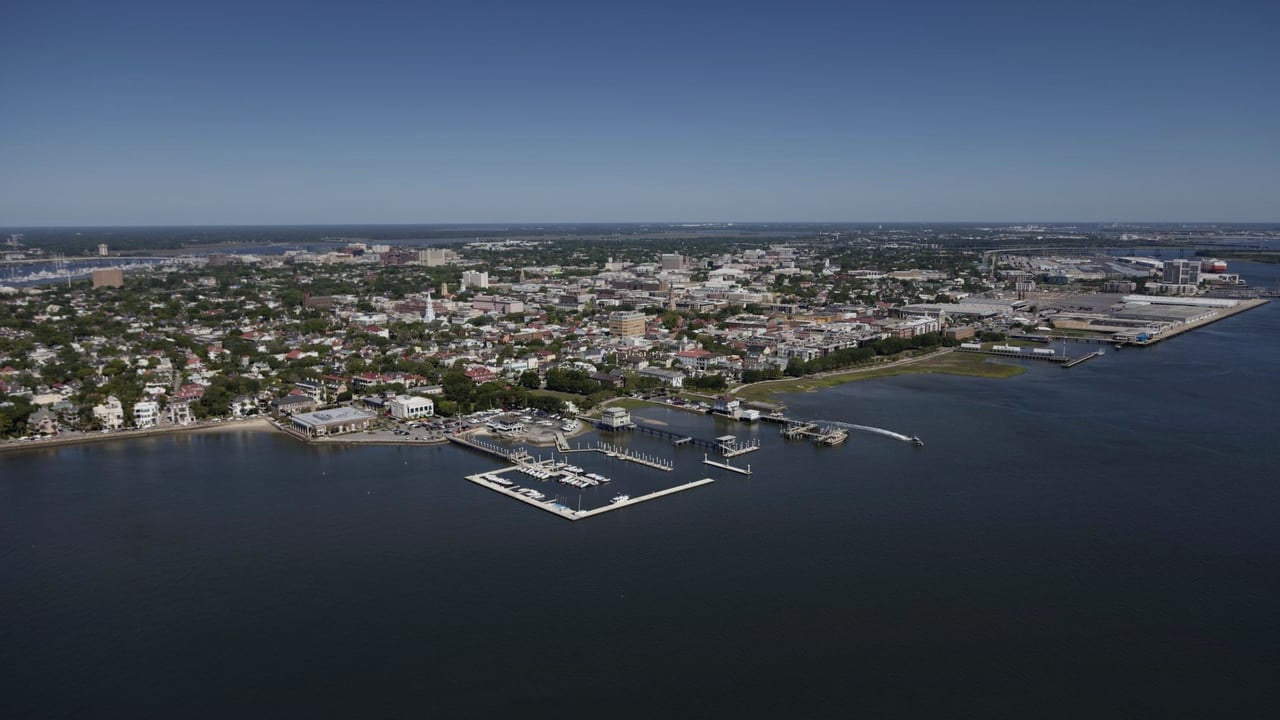
Aerial view of the Charleston peninsula and harbor

Charleston Real Estate Fall 2026 Market Update: What the Q3 Numbers Say

Market Update

In August, I shared our mid-year look at the Charleston luxury market. Fall is here, and the September numbers are in. So let's check in.

The short version: more homes are closing, prices are holding, and mortgage rates moved up. Here is what I'm watching, and what it means for you.
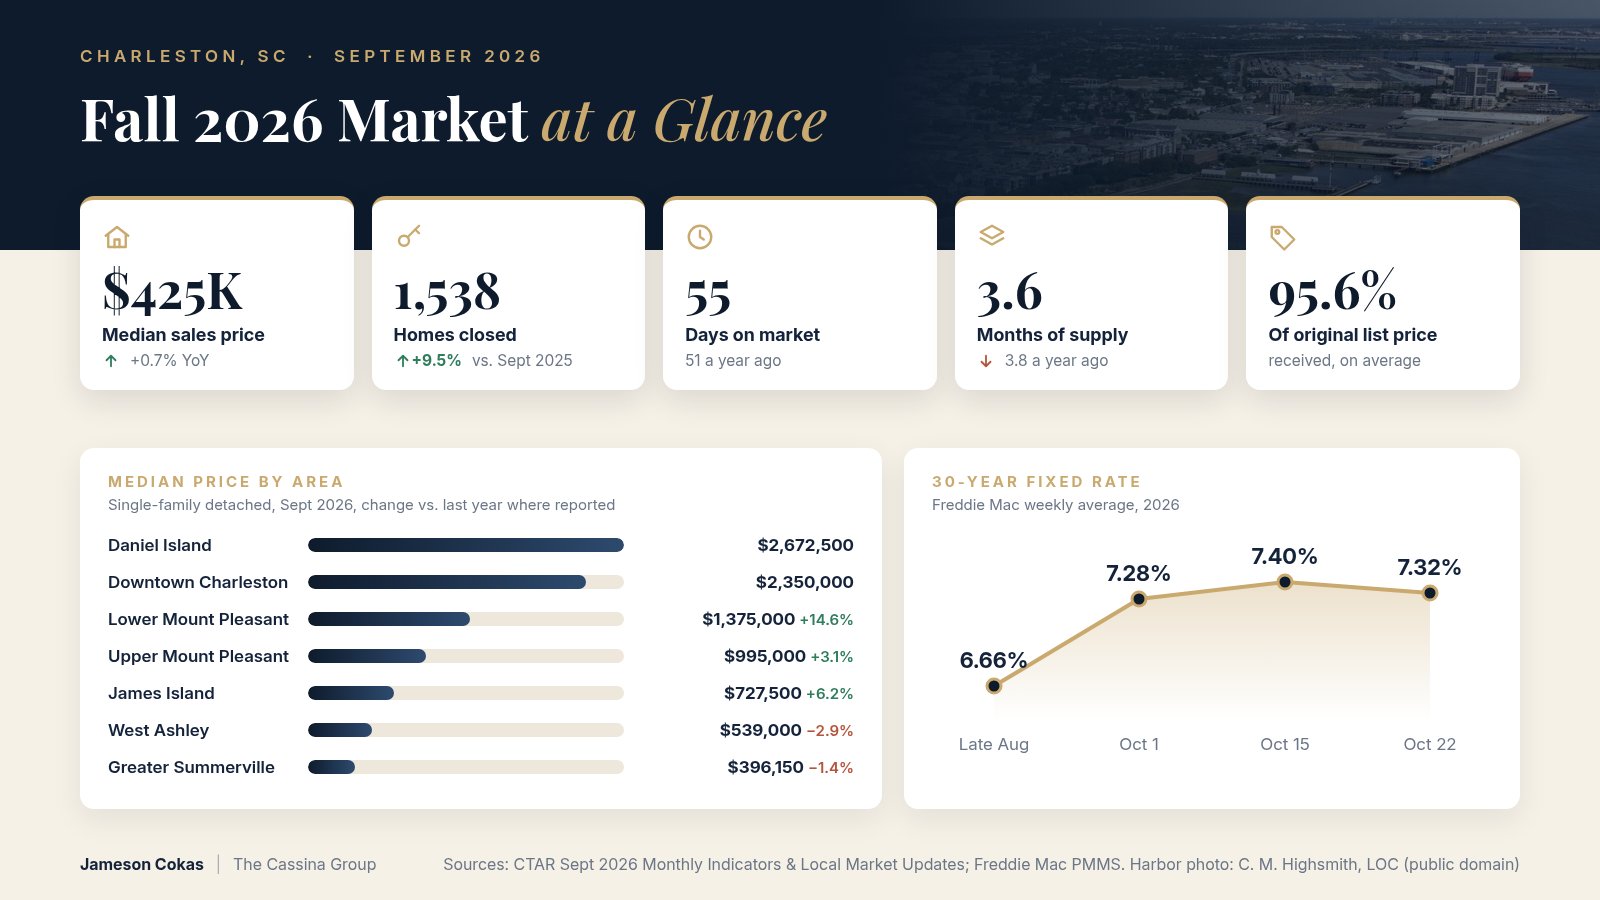
Charleston Fall 2026 market at a glance: September closed sales, median price, days on market, months of supply and 30-year mortgage rate trend

What's Happening Now

The Charleston Trident Association of REALTORS® released its September report on October 9. Across the region:

  • 1,538 homes closed in September. That is up 9.5% from last September.
  • The median sales price was $425,000. That is up 0.7% from a year ago. Year to date, the median is $435,000, up 2.3%.
  • Homes took 55 days, on average, to go under contract. Last September it was 51 days.
  • Sellers received 95.6% of their original list price, on average.
  • There were 5,590 homes for sale. That is almost the same as a year ago.
  • Months of supply dipped to 3.6, down from 3.8 last September.

For the full quarter, July through September, 4,900 homes closed. That is about 4% more than the same three months last year.

So buyers are still buying. Prices are steady, not jumping. And homes are taking a little longer to sell.

The Rate Picture

Rates are the big change since my last update. Freddie Mac's 30-year fixed average was 6.66% in late August. By October 1, it reached 7.28%. As of October 22, it sits at 7.32%, down a bit from 7.40% the week before.

The CTAR report also notes the Federal Reserve raised its benchmark rate by a quarter point on September 16.

A one-point jump in rates changes a monthly payment in a real way. That is the biggest thing shaping this fall.

What It Means for Buyers

  • You have time. At 55 days on market, most homes are not selling in a weekend. You can tour twice, ask questions, and do your inspections.
  • There is room to talk. Sellers are getting about 95.6% of their original asking price. Price, repairs, closing costs, and timing are all worth discussing.
  • Get your numbers first. With rates above 7%, talk to a lender before you shop. Ask about rate buydowns and seller credits.
  • Look past the median. Each area moves on its own. The snapshots below show how different they can be.

What It Means for Sellers

  • Pricing matters most. Buyers are watching their monthly payment closely. A home priced right from day one tends to draw the best offers.
  • Plan for a longer timeline. Build 50 to 60 days into your plans, not two weeks.
  • Condition still wins. Homes that are clean, repaired, and ready to move in stand out when buyers have choices.
  • Be open to terms. A credit toward a buyer's rate can do more than a price cut. Let's look at both.

Area Snapshots: September 2026

These numbers are for single-family detached homes, from CTAR's September 2026 Local Market Updates. Some areas have a small number of sales each month, so one month can swing a lot. Treat these as a pulse check, not a trend.

  • Lower Mount Pleasant: 53 closed sales, up from 41. Median price $1,375,000, up 14.6%. Homes for sale fell to 133, from 171.
  • Upper Mount Pleasant: 63 closed sales. Median price $995,000, up 3.1%. Homes for sale fell to 151, from 186.
  • Daniel Island: 26 closed sales, up from 11. Median price $2,672,500. Homes for sale rose to 44, from 28. That is more choice than a year ago.
  • Downtown Charleston: 13 closed sales. Median price $2,350,000. Sellers received 92.1% of original list price, the lowest of the areas here.
  • James Island: 34 closed sales. Median price $727,500, up 6.2%. Homes went under contract in 38 days, on average.
  • West Ashley: 60 closed sales. Median price $539,000, down 2.9%. Homes for sale rose to 233, from 215.
  • Greater Summerville: 183 closed sales. Median price $396,150, down 1.4%. Homes for sale rose to 686, from 631.

The pattern: Mount Pleasant has fewer homes for sale than last year. Daniel Island, West Ashley, and Summerville have more. That shifts who has the edge, street by street.

What to Watch This Winter

  • Rates. Even a small dip can bring buyers back. I'll keep an eye on Freddie Mac's weekly numbers.
  • Fewer new listings. New listings were down 0.5% in September. Listings usually slow down in the colder months. Fewer homes can mean less competition for sellers, and fewer options for buyers.
  • Insurance and flood costs. These still affect what a home really costs to own here. Get quotes early.
  • Spring prep. If you plan to sell in spring, winter is the time to fix, paint, and plan.

Let's Talk

Every street in the Lowcountry has its own story. These numbers are a starting point, not the full picture.

If you're thinking about buying or selling, or you just want to know what your home might be worth, reach out. I'm happy to pull the numbers for your neighborhood and walk through them with you. No pressure, just a clear picture.

Call or text me at (443) 864-2332, or email [email protected].

Talk soon,
Jameson
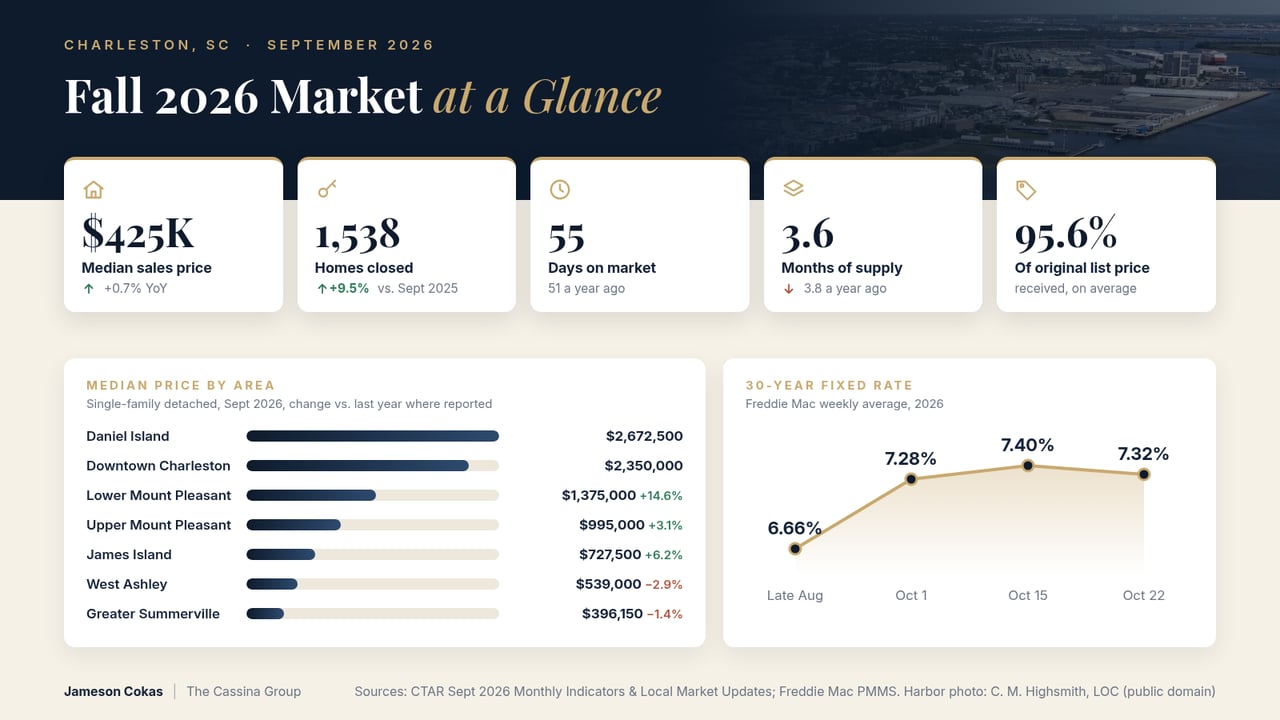
Aerial view of the Charleston peninsula and harbor

Recent Blog Posts

Closing Costs in SC: Who Pays What in Charleston

A plain-English guide for buyers and sellers: the deed recording fee, attorney closings, tax prorations and the costs on your Closing Disclosure.
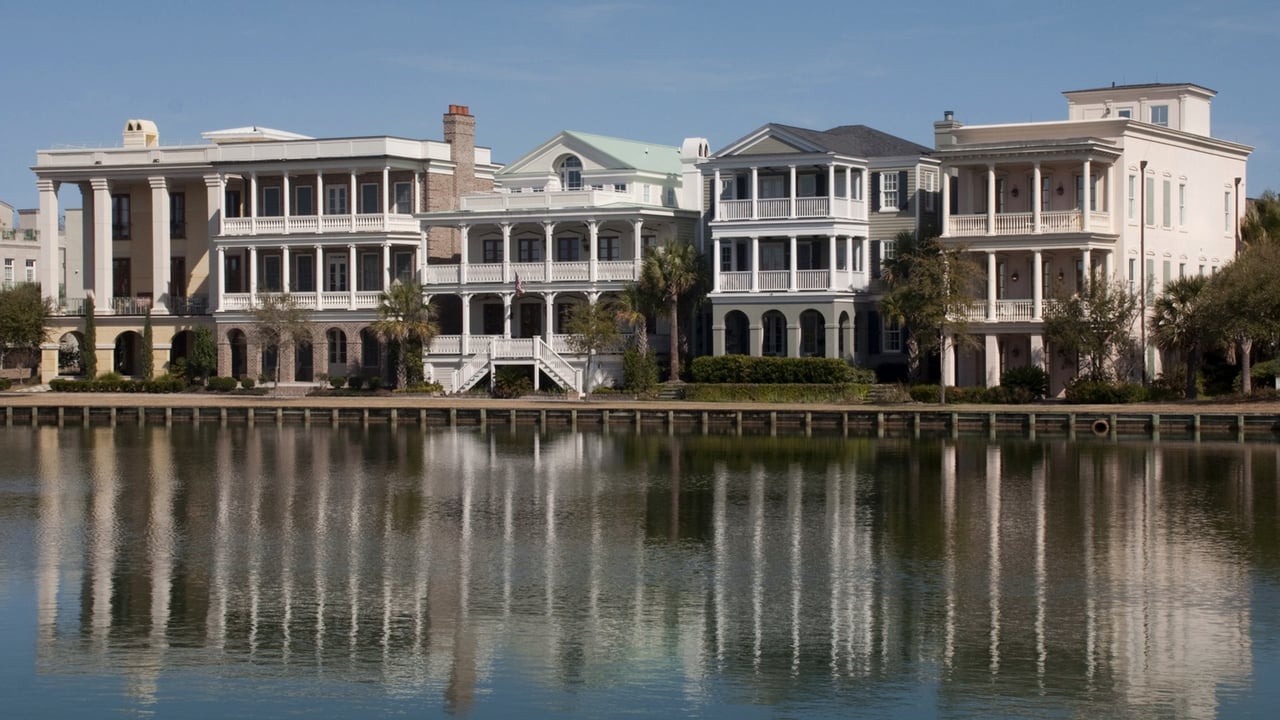
Row of white and cream Lowcountry-style houses with deep columned porches reflected in a still lake in Mount Pleasant SC, one of the suburbs of Charleston

Market Update

Best Suburbs of Charleston SC: Comparison Chart + Guide

2026 home prices, days on market, commutes and county lines for 11 areas around Charleston, side by side.

Wappoo Creek drawbridge between James Island and West Ashley in Charleston SC, with both bridge leaves raised under a cloudy sky
Living on James Island SC: What to Know Before You Buy

Three local governments, a big county park, flood zones that vary by street, and what homes sold for this fall.
Charleston single house with black shutters, red roof and white side piazza beside a palmetto on a sunny winter day in Charleston SC

Market Update

Best Time to Sell a House in Charleston SC: What a Year of Data Shows

Winter vs. spring by the numbers, and how to get your home ready this season.
Pastel pink, lavender and mint historic row houses with black shutters and palmetto trees on Rainbow Row in Charleston, SC
Moving to Charleston SC: What to Know Before You Move

Flood and evacuation zones, the 4% property tax rate, and your first 45 days as a South Carolina resident.
Shrimp boats on Shem Creek in Mount Pleasant at dusk
Old Village Mount Pleasant SC: A Neighborhood Guide

History, Pitt Street Bridge, Alhambra Hall, Shem Creek, and what the historic district rules and flood zones mean before you buy.

Lowcountry tidal creek winding through salt marsh
Charleston SC Flood Zones: A Buyer and Seller Guide

How to look up any address, what Zones AE, VE and X mean, and what to know about flood insurance in Charleston and Mt. Pleasant.

Aerial view of the Charleston peninsula and harbor

Market Update

Charleston Real Estate Fall 2026 Market Update: What the Q3 Numbers Say

More homes are selling, prices are steady, and rates moved higher. Here is what that means for your next move.
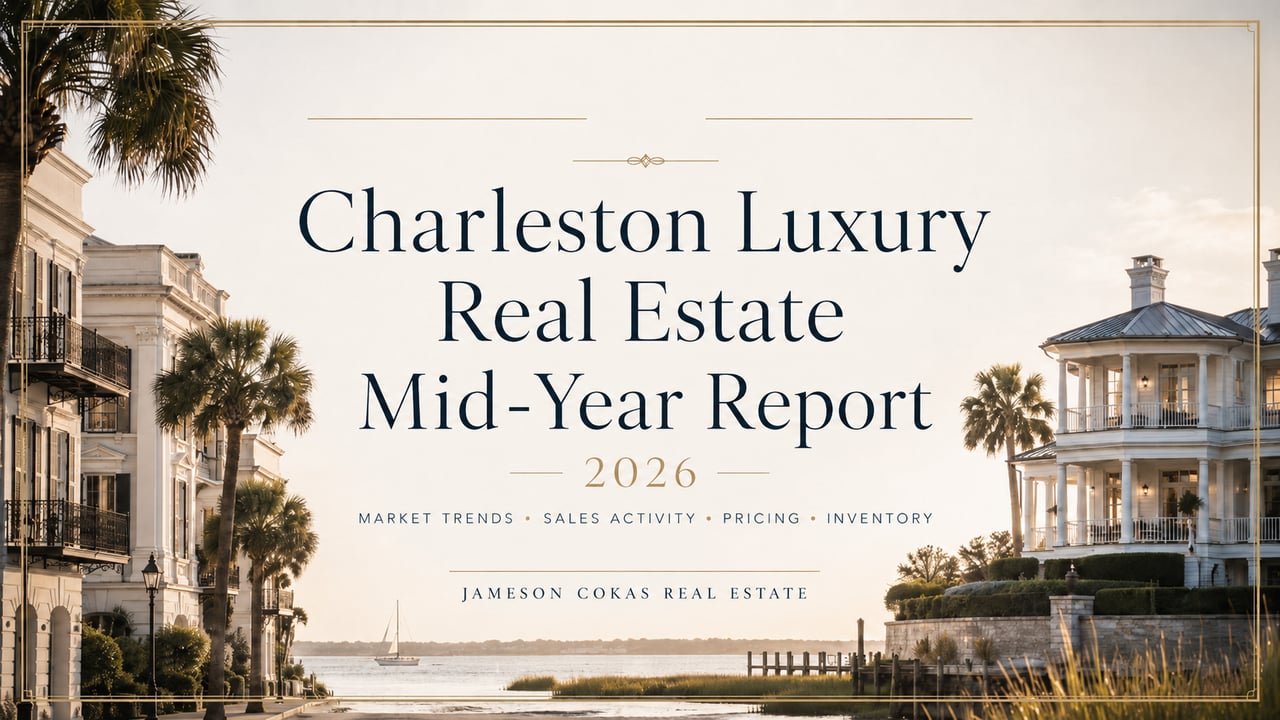

Cover for the 2026 Charleston Luxury Real Estate Mid-Year Report by Jameson Cokas Real Estate.
Charleston Luxury Real Estate: The 2026 Mid-Year Market Report Every Buyer Needs

Work With Jameson

Work With Jameson

Experience the white-glove service you deserve! With a background in sports and entertainment real estate, he exceeds expectations, delivers quality advice, and ensures your best interests are always prioritized. Choose excellence for your real estate journey.